
Ask what fault caused the Christchurch earthquakes and the honest answer, before 4 September 2010, would have been that nobody had ever heard of it. The magnitude 7.1 Darfield earthquake broke the Greendale Fault, a structure that appeared on no map. The magnitude 6.2 earthquake that killed 185 people on 22 February 2011 came from a second unknown structure, the Port Hills Fault, and that one never reached the surface at all.
Next month it will be sixteen years since the sequence began, and in that time the crust beneath Canterbury has become the most intensively studied in New Zealand. Aircraft have flown magnetic surveys over the plains, research ships have towed seismic gear across Pegasus Bay, and trenches have been cut across the Greendale Fault to read its history. This piece pulls together what all of that work now tells us, about the faults themselves, about why nobody knew they were there, and about what remains beneath the city. You can watch anything new as it happens on our live earthquake map.

Newswire also searched the GeoNet earthquake catalogue for this article, and the numbers tell their own story. In 2025 the wider Christchurch area recorded five earthquakes of magnitude 3 or above, a figure finally back in the range of two to eight a year that was normal before Darfield. The sequence took fifteen years to quieten, and the full decay is charted below.
- The magnitude 7.1 Darfield earthquake, 4:35am on 4 September 2010, ruptured the previously unknown Greendale Fault
- The magnitude 6.2 Christchurch earthquake, 12:51pm on 22 February 2011, came from the blind Port Hills Fault and killed 185 people
- Both faults are ancient fractures from the break-up of Gondwana, reawakened by today’s plate boundary
- GeoNet has located 16,927 earthquakes in the wider area since September 2010, with activity decaying year by year
- GeoNet’s most recent Canterbury forecast, issued in February 2025, put the chance of a magnitude 5.0 to 5.9 quake within a year at 29 percent
The five major earthquakes
The Canterbury earthquake sequence produced five earthquakes big enough to damage the city, spread across five and a half years. The table lists them with GeoNet’s catalogue figures.
| Date | Magnitude | Depth | Where |
|---|---|---|---|
| 4 September 2010 | 7.1 | 11 km | Near Darfield |
| 22 February 2011 | 6.2 | 5 km | Under the Port Hills |
| 13 June 2011 | 6.0 | 7 km | Near Sumner |
| 23 December 2011 | 5.9 | 8 km | Offshore New Brighton |
| 14 February 2016 | 5.7 | 8 km | Offshore in Pegasus Bay |
The pairs matter. A magnitude 4.7 jolt directly beneath the central city spoiled Boxing Day morning in 2010. The 13 June 2011 earthquake was preceded by a magnitude 5.3 shock eighty minutes earlier, which had already emptied buildings by the time the bigger one hit. The 23 December 2011 event arrived as a double, a magnitude 5.8 followed by a 5.9 an hour and twenty minutes later, both just off the New Brighton coast.
One housekeeping note on the numbers. GeoNet’s catalogue now lists Darfield at magnitude 7.2, while the published scientific value is moment magnitude 7.1, and February 2011 is magnitude 6.2 in the catalogue though it was widely reported as 6.3 at the time. These are differences of method rather than revisions of the events, and we use the published scientific values throughout, as GeoNet’s own pages do.
The Greendale Fault
The fault that started everything runs east to west beneath the paddocks between Darfield and Rolleston, buried under gravels washed down from the Southern Alps by the Waimakariri and Rakaia rivers over tens of thousands of years. Those gravels are why no geologist had ever mapped it. There was simply nothing at the surface to see, and a review of pre-2010 exploration data found that even an oil and gas seismic survey line across the plains had not convincingly picked it up.
On 4 September 2010 the fault announced itself emphatically. The surface rupture mapped by Mark Quigley’s team tore across farmland for at least 29.5 kilometres. The land on the south side lurched east relative to the north side, by about 2.5 metres on average and up to 5.2 metres in the central section, offsetting fences, hedgerows, irrigation channels, roads and one unlucky farmhouse. Geologists call this dextral strike-slip, which simply means that if you stood astride the fault, the far side moved to your right.
Here is the detail most retellings miss. The earthquake did not start on the Greendale Fault. Analysis of the rupture shows it began on a small, steeply dipping reverse fault near Charing Cross, buried and blind, and within seconds the failure jumped onto the Greendale Fault and unzipped it east and west. At least half a dozen fault segments moved in one earthquake. What looked like a single clean break was really a hidden network failing together, a theme the rest of the sequence would repeat.
Nobody died in the Darfield earthquake, partly because it struck at 4:35am when the streets were empty, and partly because the rupture stopped about 20 kilometres short of the city. As we noted in our Taumarunui earthquake geology explainer last month, an earthquake on a fault nobody has mapped is not unusual in New Zealand, and Greendale remains the country’s defining example.
The Port Hills Fault
The Port Hills Fault is a different beast. A blind fault is one whose ruptures never break through to the surface, and the Port Hills Fault is the textbook case. It is about 14 kilometres long, runs east north east beneath the northern edge of the Port Hills, and dips at about 69 degrees to the south east, sloping down beneath Lyttelton Harbour.
On 22 February 2011 it failed. The rupture began about six kilometres down, slightly deeper than the catalogue’s listed five, then spread upwards and towards the north west, towards the city, with the fault’s southern side driving up and over the northern side while also slipping sideways. The Port Hills rose by centimetres to tens of centimetres. But the rupture died out about a kilometre below the surface, which is why no trace of the fault had ever been seen, and why nobody can point to a scar in the ground today.
The fault’s address invites an obvious question, because the Port Hills are the eroded rim of the ancient Lyttelton volcano. The connection is spatial, not causal. The fault is a far older basement structure that happens to lie along the volcano’s buried northern flank, and the volcanoes of Banks Peninsula, active between roughly 12 and 6 million years ago, are long extinct. No magma was involved in any of these earthquakes.
One naming note. You may also come across a separate Christchurch Fault. That is an inferred structure, proposed in 2011 by the visiting American seismologist Kevin Furlong, traced through aftershock patterns as running from near Riccarton, beneath the central city and the eastern suburbs and out past New Brighton, roughly parallel to the Port Hills Fault and about five kilometres to the north of it, and linked to the Boxing Day 2010 shake rather than to anything in February. GNS Science did not comment on the proposed location at the time. If you have seen both names and wondered whether they are the same fault, they are not, and the one that destroyed the central city in February 2011 is the Port Hills Fault.
Why the February 2011 earthquake was so violent
The February earthquake killed 185 people, most of them in the collapse of two central city buildings, and injured thousands more. It released roughly twenty times less energy than Darfield, yet was incomparably more destructive. Sixteen years of research has explained why, and the answer comes in three parts.
A shallow rupture aimed at the city
The rupture was five kilometres deep and about seven kilometres from Cathedral Square, and it spread upwards and towards the city, so the energy piled up in the direction of travel the way sound piles up ahead of a fast aircraft. Darfield was a bigger earthquake, but its energy had to cross 40 kilometres of plains to reach town. February’s was delivered from next door, straight up. Distance and depth, more than magnitude, decide what a city experiences.
Strong old rock breaking hard
The Canterbury earthquakes released unusually large amounts of stress for their size, what seismologists call a high stress drop, and this is now understood as a property of the region itself. Research led by GNS Science’s Martin Reyners, published in Nature Geoscience, found that a slab of ancient thickened ocean floor called the Hikurangi Plateau lies welded beneath Canterbury, making the crust above it exceptionally strong. Strong rock stores more stress before it fails, and releases it more violently when it finally does.
The same strength explains the sequence’s stamina. In weaker crust, deeper layers flow and bleed stress away. Under Canterbury the crust stayed brittle to unusual depths, and the study argues fluids seeping up from the buried plateau gradually weakened it, so each earthquake handed stress to its neighbours and the sequence ground on for years, a point we will return to in the aftershock data.
Soft ground that made it worse
The city sits on a basin of soft sediments that traps and amplifies shaking, and in the steep valleys at the foot of the hills the effect was extreme. Instruments at Heathcote Valley Primary School recorded vertical accelerations of up to 2.2 g, meaning the ground briefly pushed upwards at more than twice the acceleration of gravity. A 2021 re-analysis concluded the sensor’s concrete pad exaggerated the sharpest spikes and the true peak was probably closer to 1.4 g, but either way it was the strongest shaking ever recorded in New Zealand to that point, and it held the record until the 2016 Kaikōura earthquake.
Part of the vertical violence came from what researchers call the trampoline effect, first described in Japan in 2008, in which loose near-surface soil is flung upward and momentarily separates from the ground below, then slams back down. Many residents also reported hearing a sharp crack just before the worst shaking, the sound of the rupture arriving. Objects, and people, were thrown into the air. Buildings engineered for sideways shaking received a blow from below as well.
Liquefaction and the red zone
The eastern half of the city sits on young, loose, water-soaked sand and silt laid down by rivers and old swamps. Shake ground like that hard enough and the water pressure between the grains rises until the soil stops behaving like a solid, and the land itself fails. That is liquefaction, and Christchurch experienced it on a scale rarely documented anywhere, not once but repeatedly, in September 2010, February, June and December 2011.
Streets in the eastern suburbs and Kaiapoi flooded with grey ejected silt, houses settled and tilted, and buried pipes and foundations broke in the same places each time. The land, not the buildings, was the unfixable problem. In the end the Crown designated a residential red zone and bought out around 8,000 properties, most along the Avon River, and those suburbs have since returned to open ground.
Why the faults were hidden
An ancient scar under the plains
The basement rock beneath Canterbury is greywacke, the hard grey sandstone that makes up the Southern Alps and much of New Zealand’s foundation. Around 85 million years ago, as the fragment of Gondwana that became Zealandia tore away from Antarctica and Australia, that basement was stretched and broken along east to west trending faults. Gravity and magnetic surveys flown after the earthquakes show those old fracture patterns running right through the region, and the Greendale and Port Hills faults follow them.
Today the plate boundary through the South Island squeezes the region from the west, and the squeeze is slowly reawakening the old fractures in new roles, some as sideways-sliding faults like Greendale, some as thrusts like the Port Hills Fault. Canterbury sits well east of the main plate boundary, so it accumulates strain far more slowly than the Alpine Fault or the Marlborough faults. The faults are there, but each one moves very rarely.
Faults that sleep for tens of thousands of years
Rare means easy to hide. Between ruptures, the rivers coming off the Alps bury the evidence under fresh gravel, and a fault that moves once every few hundred human lifetimes leaves no memory to protect. After 2010, geologists cut trenches across the Greendale rupture and dated the buried sand layers it had displaced, using a technique that measures when sand grains last saw sunlight. The trenching showed the fault’s previous rupture was 20,000 to 30,000 years before 2010, and its average repeat time is estimated at 10,000 years or more, possibly much longer.
Sit with that number for a moment. When the Greendale Fault last broke, the last ice age was near its peak and no human had set foot in New Zealand. Faults like this will never dominate a hazard map the way the Alpine Fault does, but there are many of them, and any one of them can wake up on any given morning. That is the uncomfortable arithmetic the Canterbury earthquakes taught the whole country.
The search for other hidden faults
The most significant discovery of the post-quake fault hunt lies under the sea off Kaiapoi. In 2011 NIWA’s research vessel Kaharoa surveyed 800 square kilometres of southern Pegasus Bay and found a previously unknown fault about 25 kilometres long just east of the town, large enough to generate an earthquake of magnitude 6 to 7. It was not alone. The full survey programme mapped at least 11 major buried faults within 30 kilometres of the coast, structures capable of earthquakes in the magnitude 6.4 to 7.2 range, with signs of movement within the last million years.
The same reassurance applies offshore as on land. These are among the slowest moving faults known in New Zealand, with return times measured in many thousands of years, and finding them does not mean an earthquake is coming. It means the hazard is now on the books. The faults found by the helicopter magnetic surveys, the marine surveys and the onshore studies have flowed into the New Zealand Active Faults Database and the national hazard model, which is exactly where you want surprises to live, on paper rather than underfoot.
Sixteen years of aftershocks
Newswire searched GeoNet’s earthquake catalogue for the region between the plains west of Darfield and the open water of Pegasus Bay. Since the morning of 4 September 2010 it holds 16,927 located earthquakes. The pattern of that activity is the sequence’s biography, and the map below shows it, the 2010 aftershocks strung along the Greendale Fault in the west, the 2011 swarm dense under the city and the hills, and the later activity drifting offshore to the east.
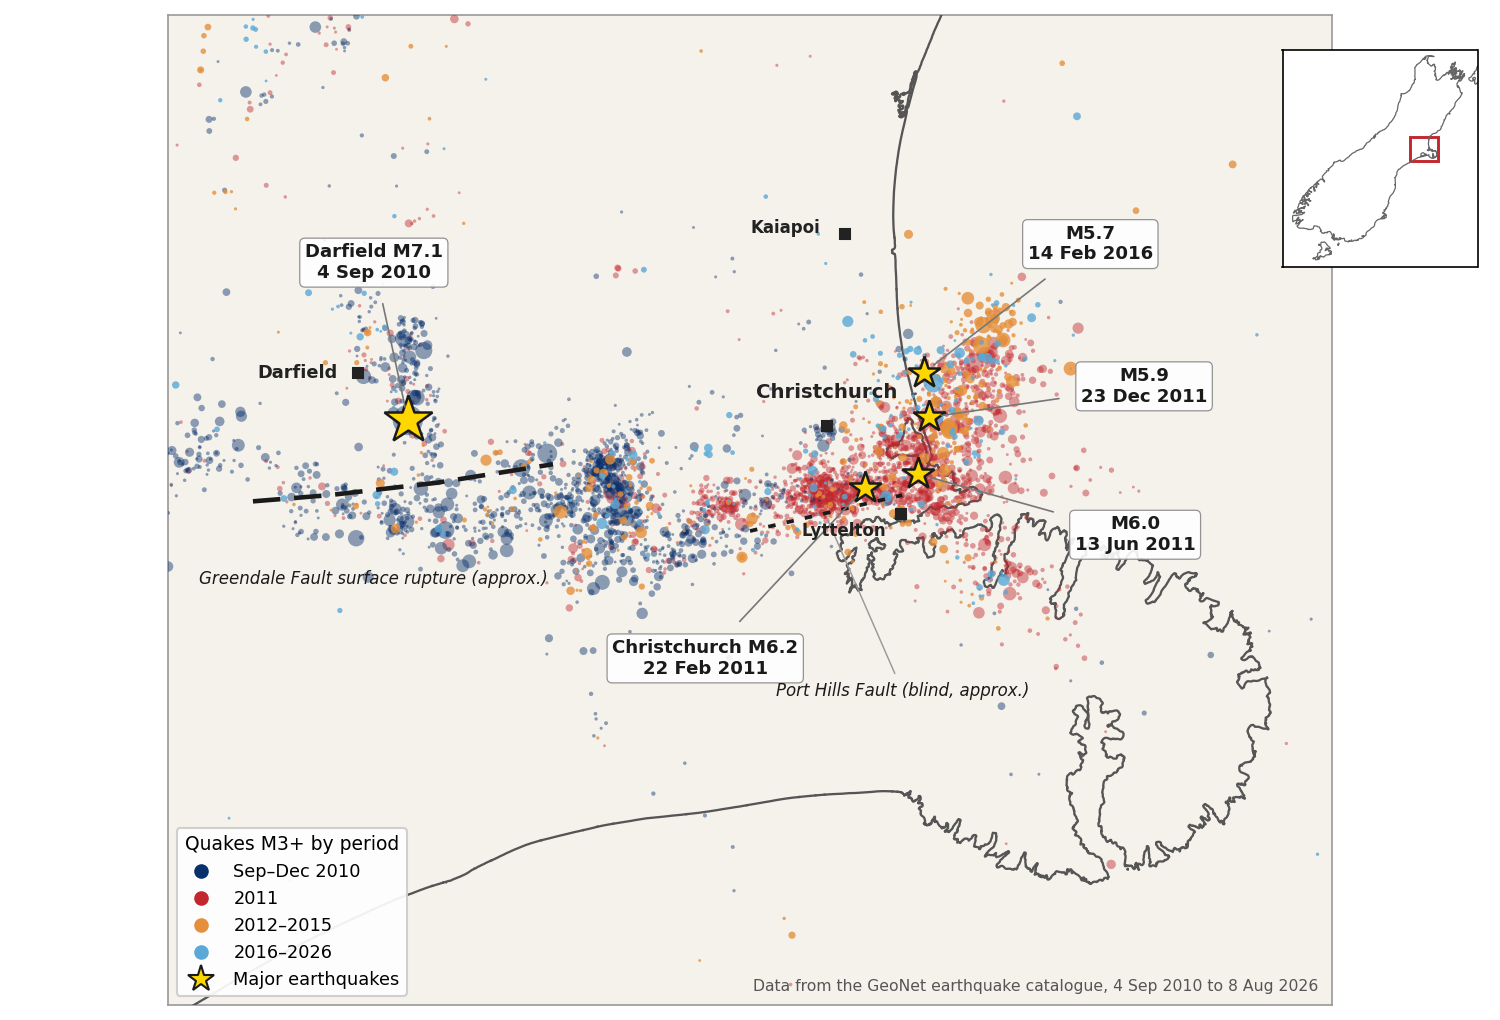
The eastward migration is one of the sequence’s signatures. Each large rupture shifted stress onto the crust beyond its end, and modelling published in Scientific Reports and later work in Geophysical Journal International shows the Darfield earthquake nudged the Port Hills Fault measurably closer to failure. Seismologists count February 2011 as part of the Darfield aftershock sequence in the statistical sense, though it ruptured a different fault entirely, and the label says nothing about severity. The migration was an observed pattern, not a schedule, and it eventually stalled offshore, where the sequence’s last big word was the magnitude 5.7 Valentine’s Day earthquake of 2016.
Aftershock sequences fade along a well-known curve, quickly at first and then ever more slowly, and Canterbury’s has followed it for sixteen years. The table counts earthquakes of magnitude 3 and above, the level at which the catalogue is reliable across the whole period.
| Year | Quakes M3+ |
|---|---|
| 2010 (from 4 Sep) | 1,285 |
| 2011 | 1,878 |
| 2012 | 240 |
| 2013 | 55 |
| 2014 | 45 |
| 2015 | 26 |
| 2016 | 57 |
| 2017 | 20 |
| 2018 | 16 |
| 2019 | 17 |
| 2020 | 21 |
| 2021 | 27 |
| 2022 | 5 |
| 2023 | 17 |
| 2024 | 13 |
| 2025 | 5 |
| 2026 (to 8 Aug) | 3 |
Read bottom to top, the table says something quietly remarkable. From nearly 1,900 magnitude 3 quakes in 2011, the area is now back to a handful a year, inside or close to its pre-2010 range. The years of grinding aftershocks that Cantabrians lived through are, on this measure, essentially over. A note on method for the sceptical reader. Our search box spans 171.9 to 173.2 degrees east and 43.2 to 44.0 degrees south, a slightly different box from the one GeoNet uses for its forecasts, and we count only magnitude 3 and above because the seismometer network became much denser after 2010, which makes counts of smaller quakes misleading across the two eras.
Could Christchurch have another big earthquake?
Canterbury is where GNS Science pioneered operational earthquake forecasting in New Zealand, fitting statistical models of aftershock decay to the live sequence, and GeoNet still publishes a rolling forecast for the region. The most recent update, issued on 1 February 2025, put it this way.
“Within the next year, there is a 29% probability (unlikely) of one or more earthquakes of magnitude 5.0 to 5.9 occurring in the area shown in the box in the map.”
GeoNet, Canterbury earthquake forecast, issued 1 February 2025
The same forecast put the chance of a magnitude 6.0 to 6.9 earthquake at 4 percent, and of magnitude 7 or above at under 1 percent. These are odds most cities on the Pacific rim would take, and as GeoNet notes on the same page, “With every month that passes without a major aftershock, probabilities will continue falling.”
The longer-term picture is less soothing, and more honest for it. The 2022 revision of the National Seismic Hazard Model, which folded in everything learned from Canterbury and Kaikōura, raised the estimated shaking hazard for Christchurch by a factor of up to about two and a half compared with the previous model. That is not because the ground got more dangerous, but because two decades of surprises taught the modellers how much the old numbers had missed.
The biggest scheduled earthquake in the South Island’s future remains the Alpine Fault, which research published in 2021 gave a roughly 75 percent chance of rupturing within 50 years. At its closest it is about 130 kilometres from Christchurch, and if February 2011 taught the country one physical lesson, it is that distance matters enormously. An Alpine Fault rupture would shake Christchurch long and hard, but the ground motions that broke the city came from seven kilometres away, not 130. What the sequence changed forever is the assumption that a quiet map means quiet ground, and the building standards and land-use rules that assumption once justified.
Explore the data. Replay the Darfield and February 2011 earthquakes and watch their shaking spread across New Zealand second by second in our interactive earthquake propagation replay.
Sixteen years on, the faults beneath Christchurch are no longer a mystery, they are a map, and the city rebuilt on top of them is measurably better prepared than the one the earthquakes found. If you lived through the Canterbury earthquakes, or have questions about the faults under your own part of the country, share them in the comments below.
This article was written by AI, briefed to report the facts, hopefully without some of the bias people bring to the job 🙂
Leave a Reply